
Option Traders and the 2020 Presidential Election
[ad_1]
The year 2020 has been one of extremes. As individuals, governments, and industries cope with the direct and indirect effects of COVID-19, global securities markets are bracing for a high-stakes US presidential election that could differ dramatically from its recent predecessors.
What can investors, asset managers, and traders reeling from the unprecedented volatility of February and March expect heading into the final months of 2020?

Indexes offer an efficient way to gauge the market, and listed index-based derivatives can provide a foundation for analysis in the form of market prices, implied volatility, open positions, and option flow sentiment.
Broad-based index options are typically used by portfolio managers and traders for precise adjustments of risk and exposure. Market-makers and liquidity providers play a crucial role in the process, risking capital and adjusting prices in response to supply, demand, and expectations of future market behavior. In the United States, liquidity is greatest in the S&P 500 Index options (SPX) on Cboe™, where approximately 1.2 million contracts, or $5 billion in premium, change hands on an average day — surging to triple these levels on the busiest days.
The unique features of SPX options, combined with the fundamental characteristics of listed options, yield valuable insight into expectations and positioning ahead of significant events like the 2020 US presidential election.
Prices and Volatility
In theory, accurate valuation of options is a function of the underlying price, time to expiration, strike, interest rates, dividends, and volatility. While all inputs are subject to some degree of uncertainty, volatility receives the most attention in practice because a severe mis-estimation of volatility can result in unexpected trading outcomes.
When looking at option prices, the midmarket level of implied volatility at any given time indicates the market expectation of the magnitude of daily returns over the duration of the option. Many option traders “think” in volatility rather than price terms, which enables an easy comparison across products and periods of time.
Implied volatilities of interpolated at-the-money SPX options on 1 September 2020 and 1 September 2016 show dramatically different expectations. In 2016, 90-day options, which included the 8 November election, were trading with 13% implied volatility, about 2 points above the short-term options. Although a slight election “bump” is visible in the data, the 2016 option prices reflected a relatively smooth term structure of implied volatility, which rose to 17% in the two-year expiries.
This year, while short-term implied volatility remains elevated near 20%, the uncertainty surrounding the election term is notably higher with implied volatility near 24%. The term structure also displays a prolonged “hump,” extending another 90 days to the 180-day term, or late February 2021, which suggests a longer period of larger price variations than 2016.
SPX ATM Implied Volatility: 1 September 2016 vs. 1 September 2020

Computation of forward volatility from these implied volatilities gives another perspective on market expectations, isolating the expected volatility for individual periods of time in the future. For 2020, the 60- to 90-day forward period implied volatility stands out as a high point near 29%, with a reversion toward the 23% range over the following three months. By contrast, 2016 forward volatility was relatively flat, near 15% into the second quarter of 2017, which turned out to be well above the surprisingly low realized volatility of 2017, near 9%.
SPX ATM Forward Volatility

SPX Realized Volatility (20d) and Index Level

Based on current SPX options prices, market moves are expected to grow larger into the fall, peak near election day on 3 November, and persist several months after. In price terms, the move from current 20% volatility to 29% will be felt as common (one standard deviation) daily moves widen from 1.25% to 1.8%.
Open Interest

All SPX options trades are cleared by the Options Clearing Corporation (OCC), which publishes net outstanding contracts for each listed option daily. As positions are opened and adjusted over time, the open interest changes, providing transparency into the holdings of market participants. Open interest can be viewed at the underlying, term, and strike levels. At the highest level, aggregate SPX open interest on 1 September stood near 14 million contracts and represented $4.9 trillion in notional value.

Focusing on contracts that expire after the 2016 and 2020 elections shows similarities in overall configuration, with 2020 contract totals 16% above those of 2016, and the largest positions held in December when year-end hedges are common. Compared to 2016, 2020 SPX open interest is significantly higher in the January and March terms, consistent with positioning for a volatile period extending well into 2021.
SPX Option Open Interest

In notional terms, 2020 post-election open interest stands out with total levels near $20 billion, 88% above 2016, outpacing the 62.4% growth in the underlying and reflecting a larger scale use of the contracts at this time.
SPX Option Interest: Notional Value

Strike-level open interest offers a closer look at the timing and market levels managers are focused on, as well as notional amounts involved, subject to the understanding that multi-leg spreads, which compose nearly 70% of SPX options volume, must be considered.
SPX Open Interest by Strike, 1 September 2020 – OI>5k, Selected Terms

As of 1 September, positions over 5,000 contracts span a broad range of downside strikes, with notably large positions near 160,000 contracts at the 2500 and 3000 strike, representing roughly 30% and 15% downside exposure, respectively, from the S&P 500 Index closing value that day.
Order Flow
Option order flow can give another view on market dynamics. At the basic level, order flow analysis contextualizes trading activity to identify if the buyer or seller initiated the trade, based on techniques such as side-of-market modeling, comparison of trade price to theoretical value, and price and implied volatility impact. With added analysis to interpret multi-leg trades and algorithmic executions, order flow analysis helps identify the focus and expectations of market participants for periods of interest.
SPX order flow in post-election contracts over the past three months is dominated by December puts, which is not unusual given the popularity of the product for hedging portfolios. The most active contract, Dec 2500 puts, is one of the largest blocks of open interest today, providing a hedge struck 29% below spot.
Most Active Stock Options, Aggregate, SPX, 1 June to 1 September 2020

A sample of the largest outright trades with expiration dates after the election shows a persistent bias to puts, consistent with the long-term put/call ratio of the product near 3:2. One of the largest blocks was opened in June, when 10,000 12/31 expiry 2500 strike puts were bought for $90, a $90 million premium trade with a strike 20% out of the money that may hedge a position of $3.1 billion notional value.
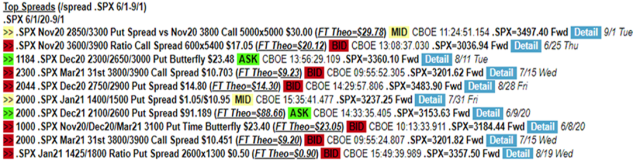
Among complex orders, puts made up seven of the top 10 non-complex trades over the interval, led by a put spread collar on 1 September, which provides a potential gain of $225 million in the event of move down 20% to 2850 in exchange for the upside risk at the 3800 (+7%) strike.

While accurate prediction of market behavior remains elusive, index options provide a data-driven window into the collective expectations of traders, portfolio managers, and investors. Based on the 1 September data, traders expect volatility to increase as 3 November approaches followed by a sustained period of volatility higher than that seen for most of the past decade. While the preponderance of downside strikes is not unusual, the notional value associated with positions expiring after the election is significantly larger than the previous cycle. This reflects a combination of year-end hedges and longer-term positions intended to protect portfolios and reflect the views of managers.
This is the second installment of a series from the Index Industry Association (IIA). Cboe is a member of the IIA and supports the Association’s goals of independence, transparency, and competition of index providers.
If you liked this post, don’t forget to subscribe to the Enterprising Investor.
All posts are the opinion of the author. As such, they should not be construed as investment advice, nor do the opinions expressed necessarily reflect the views of CFA Institute or the author’s employer.
Image credit: Getty Images / photovs
[ad_2]
Source link